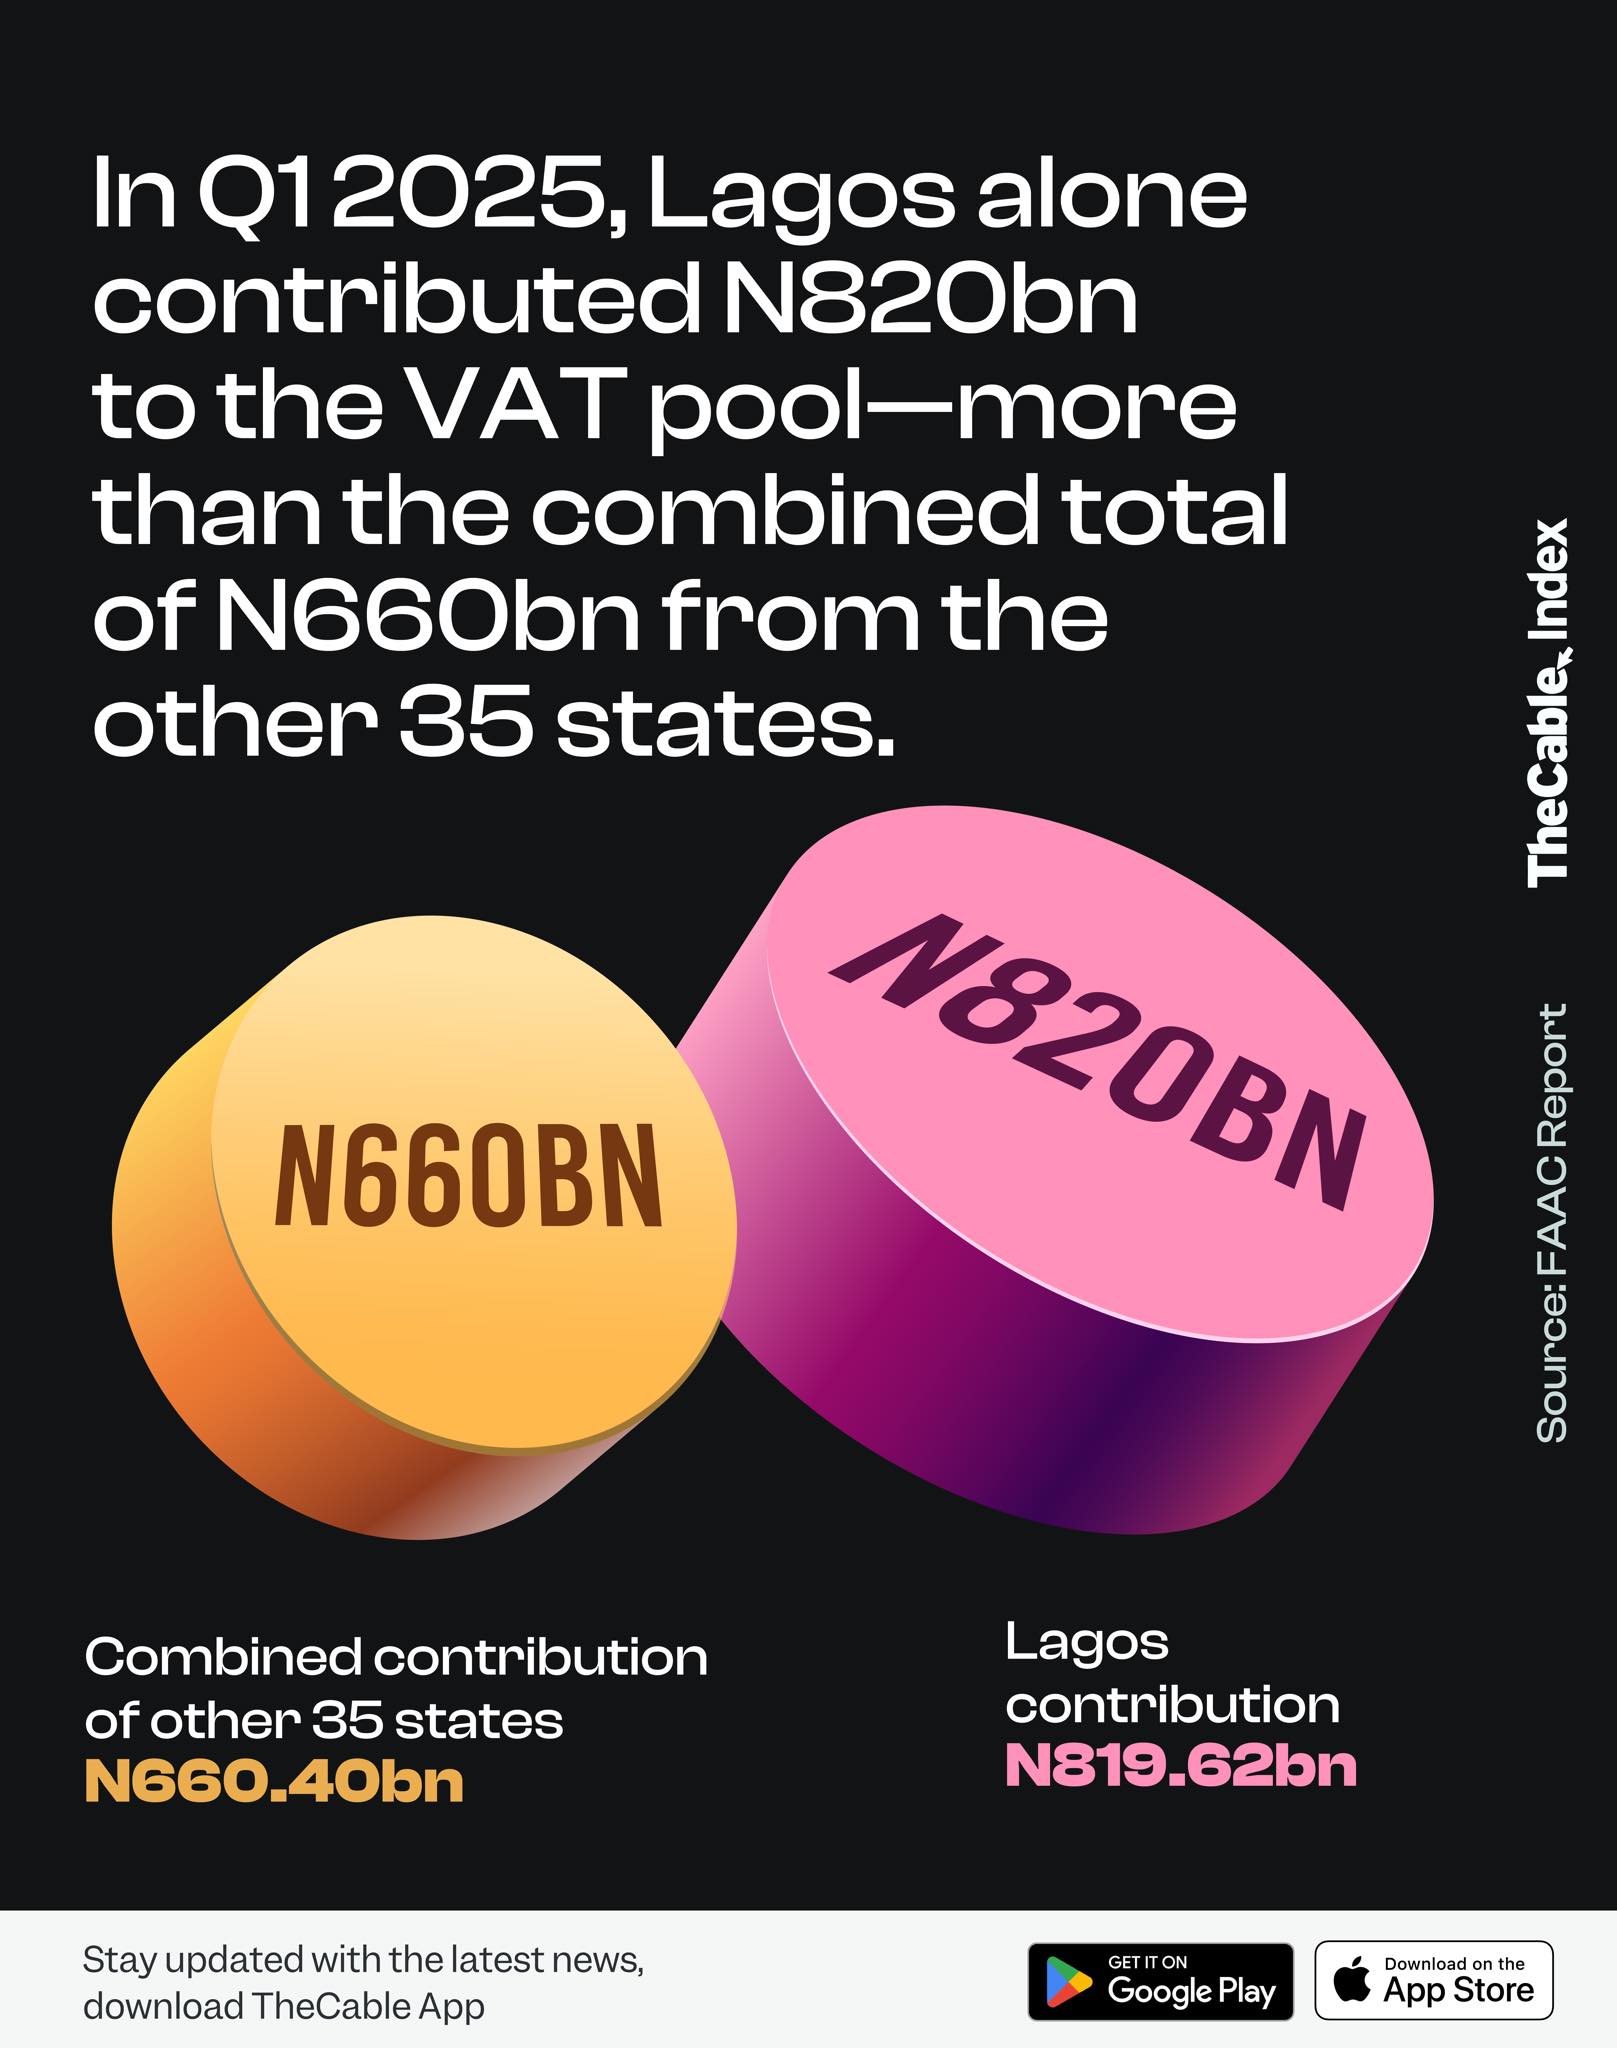
Nigeria’s latest VAT report for Q1 2025 shows Lagos State towering above the rest, contributing ₦819.62 billion—more than the combined total of the bottom 35 states.
Nigeria generated significant Value Added Tax (VAT) revenue in Q1 2025, with a wide disparity across states, according to a new FAAC report (via TheCableIndex).
Top Performers: Lagos dominated, pulling in a massive ₦819.62bn — nearly 3x the next state.
Rivers followed with ₦278.23bn, and Oyo placed third with ₦79.78bn.
Middle of the Pack:States like Bayelsa (₦27.26bn), Kano (₦22.97bn), and Edo (₦20.73bn) showed moderate performance.

Several others, including Kwara, Benue, and Ekiti, hovered around the ₦10bn–₦14bn mark. Lowest Contributors: At the bottom were Taraba (₦2.33bn), Imo (₦2.34bn), and Cross River (₦2.65bn), indicating sluggish economic activity or limited compliance.
FULL LIST: VAT generated in states across Nigeria in Q1 2025
2. Rivers: N278.23bn
3. Oyo: N79.78bn
4. Bayelsa: N27.26bn
5. Kano: N22.97bn
6. Edo: N20.73bn
7. Delta: N20.04bn
8. Akwa-Ibom: N16.08bn
9. Kwara: N14.43bn
10. Benue: N12.36bn
11. Jigawa: N11.22bn
12. Sokoto: N10.88bn
13. Anambra: N10.73bn
14. Ekiti: N10.17bn
15. Adamawa: N9.12bn
16. Kaduna: N8.12bn
17. Borno: N7.87bn
18. Ebonyi: N7.43bn
19. Kogi: N7.33bn
20. Ogun: N7.20bn
21. Ondo: N7.14bn
22. Nasarawa: N7.05bn
23. Bauchi: N6.30bn
24. Niger: N5.97bn
25. Katsina: N5.96bn
26. Osun: N5.95bn
27. Yobe: N5.81bn
28. Plateau: N5.55bn
29. Kebbi: N5.13bn
30. Enugu: N4.96bn
31. Gombe: N4.61bn
32. Zamfara: N3.77bn
33. Abia: N2.92bn
34. Cross River: N2.65bn
35. Imo: N2.34bn
36. Taraba: N2.33bn
Why it matters:
VAT performance reflects state-level business activity, consumption, and tax efficiency. The gap between Lagos and other states remains stark, underscoring Nigeria’s economic centralization.


